One place for incidents.
Status page, alerts, postmortem.
Status pages every day. Incidents when they happen. Postmortems when they end. Action items routed to Linear or GitHub.
Free for 1 project · No credit card
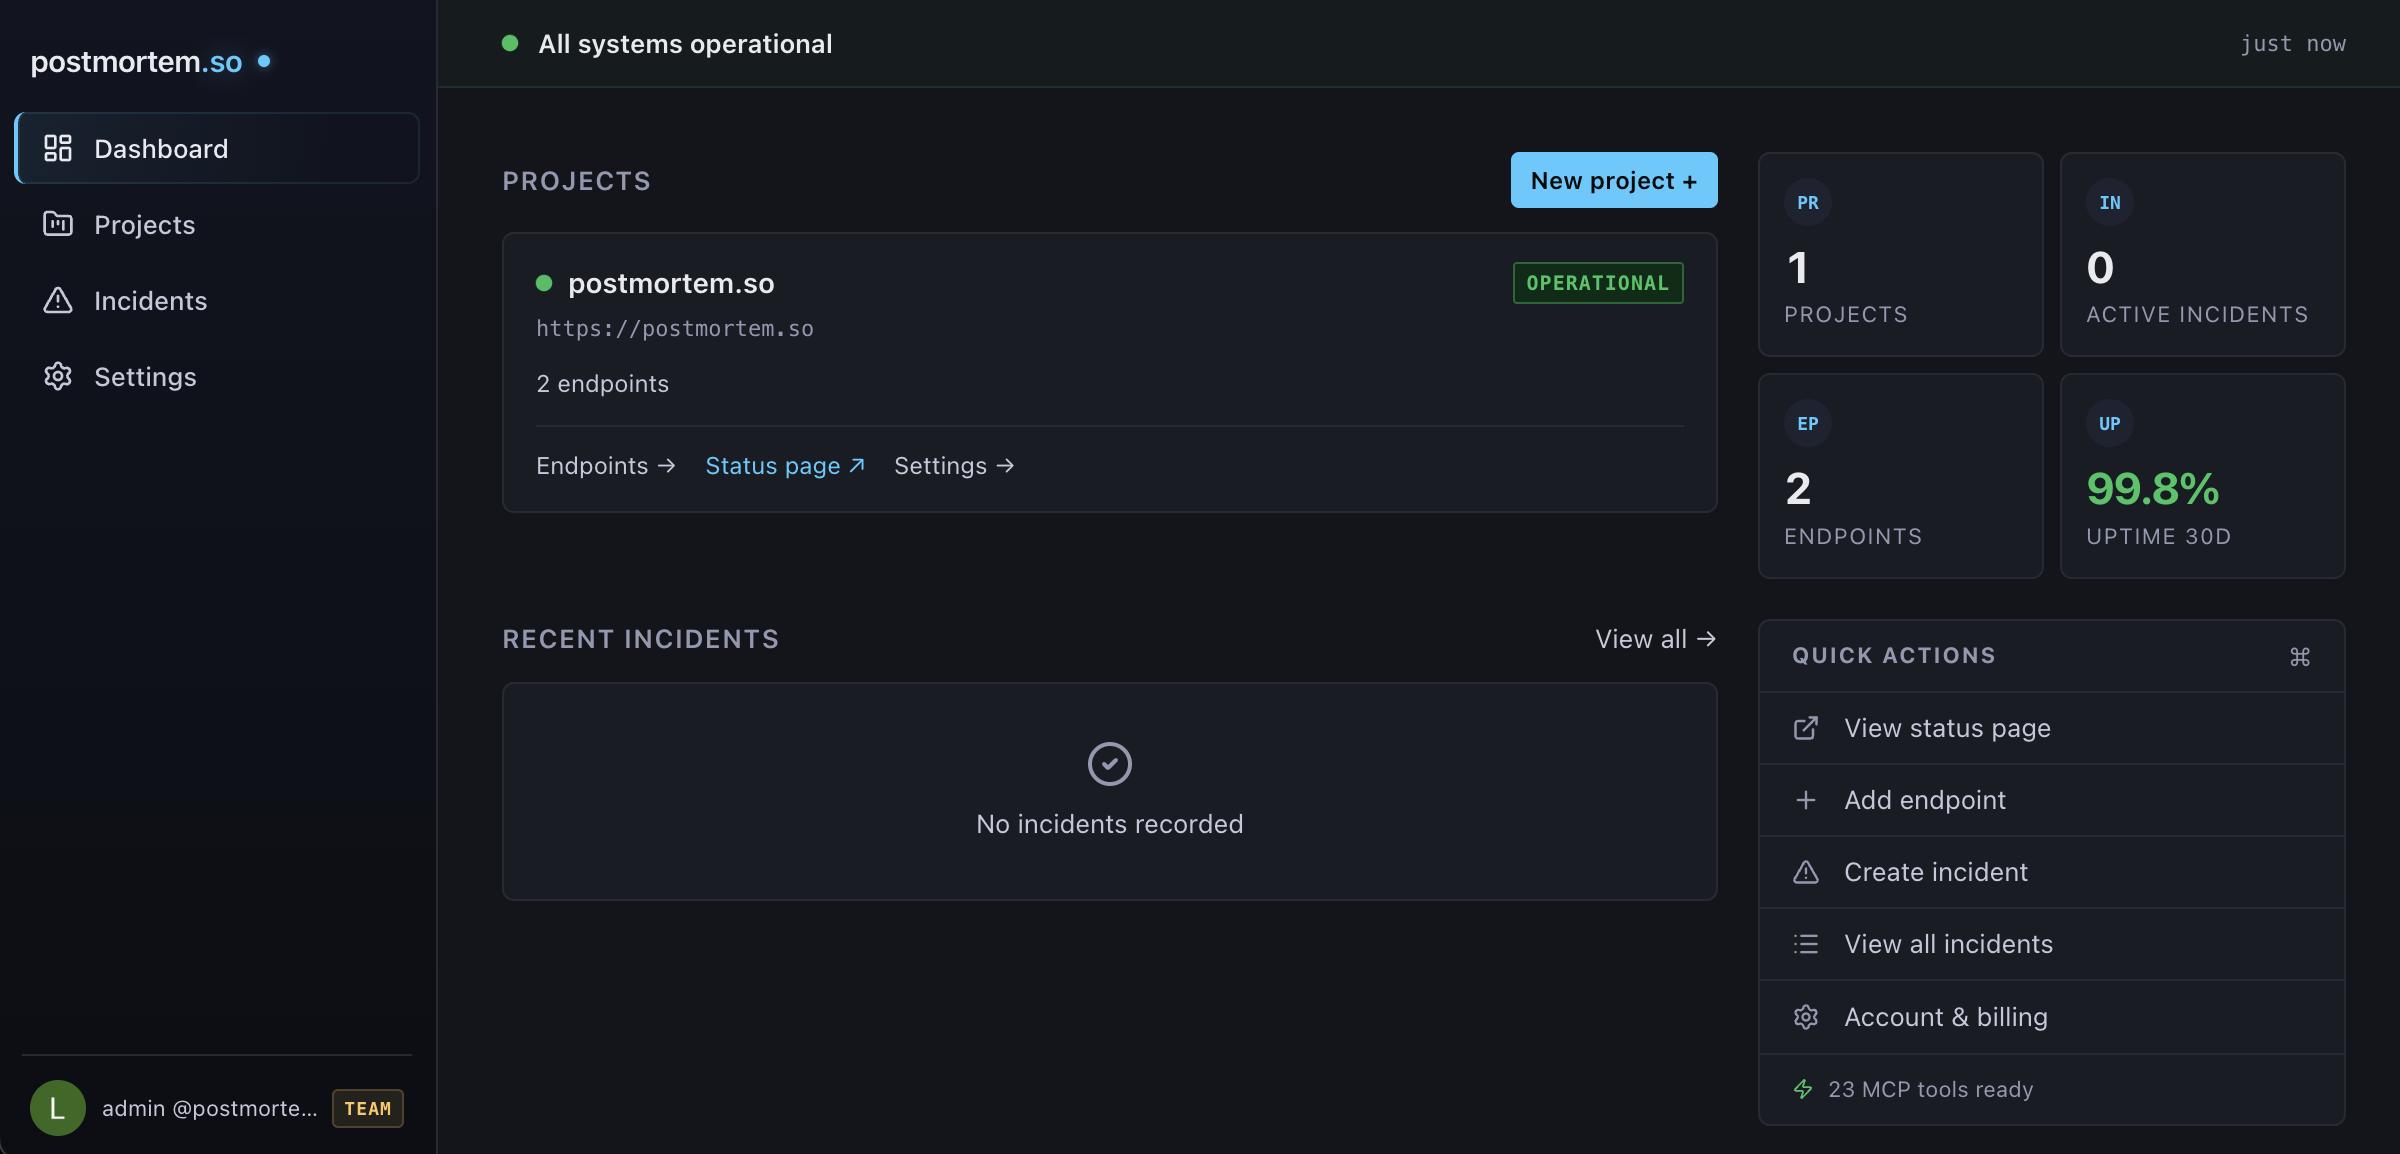
One dashboard. Connections, incidents, status pages, postmortems.
Works with your stack
Every tool in your stack.
One record per incident.
Route alerts from the tools you already use. Each alert lands on one record — error details, metric values, stack traces, timeline updates — and the postmortem is generated from that record when the incident ends.
Sentry
Error alerts, stack traces
Grafana
Metric alerts, threshold breaches
Better Stack
Uptime alerts, incident webhooks
Generic Webhook
Any tool via JSON webhook
PagerDuty
On the roadmap
Or use our built-in endpoint monitoring — 1-minute HTTP checks, no setup required.
See it in action
This postmortem wrote itself.
A complete first draft — summary, timeline, root cause, impact, action items. Ready for your judgment. Written in 3.8 seconds.
Summary
A DNS resolver failure at Vercel's edge layer caused intermittent latency spikes on postmortem.so. Requests that missed the DNS cache fell through to a secondary nameserver with a 10-second timeout, producing response times of 8–12 seconds against a baseline under 200ms. Resolved after Vercel flushed the DNS cache on affected eu-central-1 edge nodes. No HTTP errors — all requests returned 200.
Timeline
Root Cause
The DNS TTL for postmortem.so expired on Vercel's eu-central-1 edge nodes. The resolver fell back to a secondary nameserver with a 10-second timeout. Requests hitting cached DNS resolved normally — the degradation was intermittent, not a total outage.
Impact
- ~6 minutes of degraded performance
- Zero HTTP errors (all requests returned 200)
- ~30% of requests at 8–12 second response times
- Scope limited to eu-central-1 edge nodes
Action Items
| Priority | Action | Owner |
|---|---|---|
| High | Extend DNS TTL to reduce cache miss frequency | Infrastructure |
| High | Add DNS resolution latency as a monitoring signal | Observability |
| Medium | Configure fallback nameservers with shorter timeout | Infrastructure |
| Low | Set up multi-region synthetic checks | Observability |
Always on
Every day, not just bad days.
Incidents happen at 3am. Status pages run all day. Webhooks flow constantly.
How it works
Five minutes to set up.
Five seconds to write.
Connect
Your tools or ours
Point your existing monitoring at postmortem.so via webhook — Sentry, Grafana, or any tool that sends alerts. Or use our built-in endpoint monitoring with 1-minute checks. Either way, incidents flow into one place.
Detect
Incidents create themselves
When an alert fires — from a Sentry error spike, a Grafana threshold breach, or 3 consecutive endpoint failures — an incident opens automatically. Your team is alerted via email and Slack. Your status page updates in real-time.
Generate
AI postmortem in under 5 seconds
Resolve the incident. The AI reads every signal — check history, webhook payloads, error details, timeline updates — and writes a structured postmortem. Summary, timeline, root cause, impact, action items. One click pushes action items to Linear or GitHub. Pro and Team plans.
MCP integration
Your incidents,
where you already work.
postmortem.so exposes 25 tools over MCP. Create, resolve, generate, route action items — from Claude, Cursor, or any MCP client. One record. Whether your team works in the dashboard or through their AI tools, everyone reads and writes the same record.
Pricing
Simple, transparent pricing.
Start free. Upgrade when you need AI postmortems or more projects.
Free
For personal projects and side hustles.
Free tier capped at the first 200 accounts.
- 1 project
- 5 endpoints
- Public status page
- Incident timeline
- Slack webhook alerts
- 5-minute check interval
Pro
Billed €190/year — 2 months free
For teams that want the postmortem done before standup.
- 10 projects, 50 endpoints
- AI-generated postmortems
- Webhook ingestion (Sentry, Grafana, generic)
- MCP integration (25 tools)
- Email + Slack alerts (500 subscribers)
- Custom domain
- 1-minute check interval
- Priority support
Team
Billed €490/year — 2 months free
For engineering teams running incidents at scale, with compliance and white-label needs.
- Everything in Pro
- 200 endpoints
- Up to 10 team members
- 2,000 email subscribers
- 500 webhooks/hour
- White-label branding
- SLA monitoring
- Audit logs
- SSO (coming soon)
All plans include: public status page, incident timeline, Slack alerts, and read-only API access. Pro and Team add webhook ingestion from Sentry, Grafana, and any monitoring tool.